简介
本文介绍 Go 语言的一个非常强大、好用的绘图库——plot。plot内置了很多常用的组件,基本满足日常需求。同时,它也提供了定制化的接口,可以实现我们的个性化需求。plot主要用于将数据可视化,便于我们观察、比较。
快速使用
先安装:
1
|
$ go get gonum.org/v1/plot/...
|
后使用:
 1
 2
 3
 4
 5
 6
 7
 8
 9
10
11
12
13
14
15
16
17
18
19
20
21
22
23
24
25
26
27
28
29
30
31
32
33
34
35
36
37
38
39
40
41
42
43
44
45
46
47
48
49
50
|
package main

import (
  "log"
  "math/rand"

  "gonum.org/v1/plot"
  "gonum.org/v1/plot/plotter"
  "gonum.org/v1/plot/plotutil"
  "gonum.org/v1/plot/vg"
)

func main() {
  rand.Seed(int64(0))

  p, err := plot.New()
  if err != nil {
    log.Fatal(err)
  }

  p.Title.Text = "Get Started"
  p.X.Label.Text = "X"
  p.Y.Label.Text = "Y"

  err = plotutil.AddLinePoints(p,
    "First", randomPoints(15),
    "Second", randomPoints(15),
    "Third", randomPoints(15))
  if err != nil {
    log.Fatal(err)
  }

  if err = p.Save(4*vg.Inch, 4*vg.Inch, "points.png"); err != nil {
    log.Fatal(err)
  }
}

func randomPoints(n int) plotter.XYs {
  points := make(plotter.XYs, n)
  for i := range points {
    if i == 0 {
      points[i].X = rand.Float64()
    } else {
      points[i].X = points[i-1].X + rand.Float64()
    }
    points[i].Y = points[i].X + 10 * rand.Float64()
  }

  return points
}
|
程序运行输出points.png图片文件:
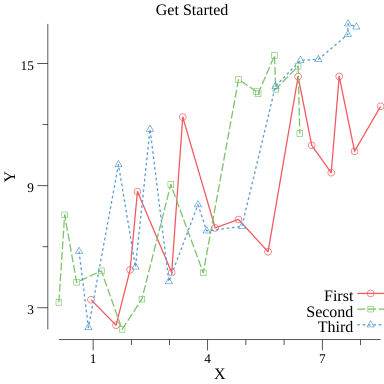
plot的使用比较直观。首先,调用plot.New()创建一个“画布”,画布结构如下:
 1
 2
 3
 4
 5
 6
 7
 8
 9
10
11
12
|
// Plot is the basic type representing a plot.
type Plot struct {
  Title struct {
    Text string
    Padding vg.Length
    draw.TextStyle
  }
  BackgroundColor color.Color
  X, Y Axis
  Legend Legend
  plotters []Plotter
}
|
然后,通过直接给画布结构字段赋值,设置图像的属性。例如p.Title.Text = "Get Started设置图像标题内容;p.X.Label.Text = "X",p.Y.Label.Text = "Y"设置图像的 X 和 Y 轴的标签名。
再然后,使用plotutil或者其他子包的方法在画布上绘制,上面代码中调用AddLinePoints()绘制了 3 条折线。
最后保存图像,上面代码中调用p.Save()方法将图像保存到文件中。
更多图形
gonum/plot将不同层次的接口封装到特定的子包中:
plot:提供了布局和绘图的简单接口;plotter:使用plot提供的接口实现了一组标准的绘图器,例如散点图、条形图、箱状图等。可以使用plotter提供的接口实现自己的绘图器;plotutil:为绘制常见图形提供简便的方法;vg:封装各种后端,并提供了一个通用矢量图形 API。
条形图
条形图通过相同宽度条形的高度或长短来表示数据的大小关系。将相同类型的数据放在一起比较能非常直观地看出不同,我们经常在比较几个库的性能时使用条形图。下面我们采用json-iter/go的 GitHub 仓库中用来比较jsoniter、easyjson、std三个 JSON 库性能的数据来绘制条形图:
 1
 2
 3
 4
 5
 6
 7
 8
 9
10
11
12
13
14
15
16
17
18
19
20
21
22
23
24
25
26
27
28
29
30
31
32
33
34
35
36
37
38
39
40
41
42
43
44
45
46
47
48
49
50
51
52
53
54
55
56
57
58
59
|
package main

import (
  "log"

  "gonum.org/v1/plot"
  "gonum.org/v1/plot/plotter"
  "gonum.org/v1/plot/plotutil"
  "gonum.org/v1/plot/vg"
)

func main() {
  std := plotter.Values{35510, 1960, 99}
  easyjson := plotter.Values{8499, 160, 4}
  jsoniter := plotter.Values{5623, 160, 3}

  p, err := plot.New()
  if err != nil {
    log.Fatal(err)
  }

  p.Title.Text = "jsoniter vs easyjson vs std"
  p.Y.Label.Text = ""

  w := vg.Points(20)
  stdBar, err := plotter.NewBarChart(std, w)
  if err != nil {
    log.Fatal(err)
  }
  stdBar.LineStyle.Width = vg.Length(0)
  stdBar.Color = plotutil.Color(0)
  stdBar.Offset = -w

  easyjsonBar, err := plotter.NewBarChart(easyjson, w)
  if err != nil {
    log.Fatal(err)
  }
  easyjsonBar.LineStyle.Width = vg.Length(0)
  easyjsonBar.Color = plotutil.Color(1)

  jsoniterBar, err := plotter.NewBarChart(jsoniter, w)
  if err != nil {
    log.Fatal(err)
  }
  jsoniterBar.LineStyle.Width = vg.Length(0)
  jsoniterBar.Color = plotutil.Color(2)
  jsoniterBar.Offset = w

  p.Add(stdBar, easyjsonBar, jsoniterBar)
  p.Legend.Add("std", stdBar)
  p.Legend.Add("easyjson", easyjsonBar)
  p.Legend.Add("jsoniter", jsoniterBar)
  p.Legend.Top = true
  p.NominalX("ns/op", "allocation bytes", "allocation times")

  if err = p.Save(5*vg.Inch, 5*vg.Inch, "barchart.png"); err != nil {
    log.Fatal(err)
  }
}
|
首先生成值列表,我们在最开始的例子中生成了二维坐标列表plotter.XYs,实际上还有三维坐标列表plotter.XYZs。
然后,调用plotter.NewBarChart()分别为三组数据生成条形图。w = vg.Points(20)用来设置条形的宽度。LineStyle.Width设置线宽,这个实际上是边框的宽度。Color设置颜色。Offset设置偏移,因为每组对应位置的条形放在一起显示更好比较,将stdBar.Offset设置为-w会让其向左偏移一个条形的宽度;easyjson偏移不设置,默认为 0,不偏移;jsoniter偏移设置为w,向右偏移一个条形的宽度。最终它们紧挨着显示。
然后,将 3 个条形图添加到画布上。紧接着,设置它们的图例,并将其显示在顶部。
最后调用p.Save()保存图片。
程序运行生成下面的图片:
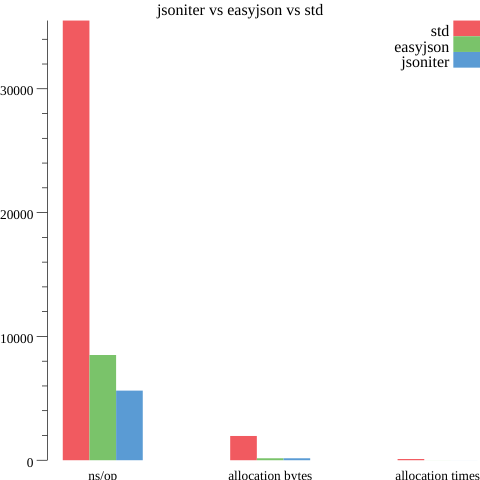
可以很直观地看到jsoniter的性能、内存占用、内存分配次数各方面都是顶尖的。可能用同一种维度的数据,数量级相差不大,图像会好看点(┬_┬)。
注意plotter.Color(2)这类用法。plot预定义了一组颜色值,如果我们想要使用它们,可以直接传入索引获取对应的颜色,更多的是为了区分不同的图形(例如上面的 3 个条形图用了 3 个不同的索引):
 1
 2
 3
 4
 5
 6
 7
 8
 9
10
11
12
13
14
15
16
17
18
19
|
// src/gonum.org/v1/plot/plotutil/plotutil.go
var DefaultColors = SoftColors
var SoftColors = []color.Color{
  rgb(241, 90, 96),
  rgb(122, 195, 106),
  rgb(90, 155, 212),
  rgb(250, 167, 91),
  rgb(158, 103, 171),
  rgb(206, 112, 88),
  rgb(215, 127, 180),
}

func Color(i int) color.Color {
  n := len(DefaultColors)
  if i < 0 {
    return DefaultColors[i%n+n]
  }
  return DefaultColors[i%n]
}
|
除了颜色,还有形状plotter.Shape(i)和划线模式plotter.Dashes(i)。
vg.Length(0)有所不同,这个只是将 0 转换为vg.Length类型!
函数图像
plot可以绘制函数图像!
 1
 2
 3
 4
 5
 6
 7
 8
 9
10
11
12
13
14
15
16
17
18
19
20
21
22
23
24
25
26
27
28
29
30
31
32
33
34
35
36
37
38
39
40
41
42
43
|
func main() {
  p, err := plot.New()
  if err != nil {
    log.Fatal(err)
  }
  p.Title.Text = "Functions"
  p.X.Label.Text = "X"
  p.Y.Label.Text = "Y"

  square := plotter.NewFunction(func(x float64) float64 { return x * x })
  square.Color = plotutil.Color(0)

  sqrt := plotter.NewFunction(func(x float64) float64 { return 10 * math.Sqrt(x) })
  sqrt.Dashes = []vg.Length{vg.Points(1), vg.Points(2)}
  sqrt.Width = vg.Points(1)
  sqrt.Color = plotutil.Color(1)

  exp := plotter.NewFunction(func(x float64) float64 { return math.Pow(2, x) })
  exp.Dashes = []vg.Length{vg.Points(2), vg.Points(3)}
  exp.Width = vg.Points(2)
  exp.Color = plotutil.Color(2)

  sin := plotter.NewFunction(func(x float64) float64 { return 10*math.Sin(x) + 50 })
  sin.Dashes = []vg.Length{vg.Points(3), vg.Points(4)}
  sin.Width = vg.Points(3)
  sin.Color = plotutil.Color(3)

  p.Add(square, sqrt, exp, sin)
  p.Legend.Add("x^2", square)
  p.Legend.Add("10*sqrt(x)", sqrt)
  p.Legend.Add("2^x", exp)
  p.Legend.Add("10*sin(x)+50", sin)
  p.Legend.ThumbnailWidth = 0.5 * vg.Inch

  p.X.Min = 0
  p.X.Max = 10
  p.Y.Min = 0
  p.Y.Max = 100

  if err = p.Save(4*vg.Inch, 4*vg.Inch, "functions.png"); err != nil {
    log.Fatal(err)
  }
}
|
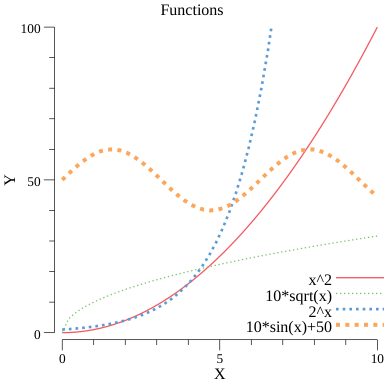
首先调用plotter.NewFunction()创建一个函数图像。它接受一个函数,单输入参数float64,单输出参数float64,故只能画出单自变量的函数图像。接着为函数图像设置了三个属性Dashes(划线)、Width(线宽)和Color(颜色)。默认使用连续的线条来绘制函数,如图中的平方函数。可以通过设置Dashes让plot绘制不连续的线条,Dashes接受两个长度值,第一个长度表示间隔距离,第二个长度表示连续线的长度。这里也使用到了plotutil.Color(i)依次使用前 4 个预定义的颜色。
创建画布、设置图例这些都与前面的相同。这里还通过p.X和p.Y的Min/Max属性限制了图像绘制的坐标范围。
运行程序生成图像:
气泡图
使用plot可以画出非常好看的气泡图:
 1
 2
 3
 4
 5
 6
 7
 8
 9
10
11
12
13
14
15
16
17
18
19
20
21
22
23
24
25
26
27
28
29
30
31
32
33
34
35
36
37
38
39
40
41
42
43
44
45
46
47
48
49
50
51
52
53
54
55
56
|
func main() {
  n := 10
  bubbleData := randomTriples(n)

  minZ, maxZ := math.Inf(1), math.Inf(-1)
  for _, xyz := range bubbleData {
    if xyz.Z > maxZ {
      maxZ = xyz.Z
    }
    if xyz.Z < minZ {
      minZ = xyz.Z
    }
  }

  p, err := plot.New()
  if err != nil {
    log.Fatal(err)
  }
  p.Title.Text = "Bubbles"
  p.X.Label.Text = "X"
  p.Y.Label.Text = "Y"

  bs, err := plotter.NewScatter(bubbleData)
  if err != nil {
    log.Fatal(err)
  }
  bs.GlyphStyleFunc = func(i int) draw.GlyphStyle {
    c := color.RGBA{R: 196, B: 128, A: 255}
    var minRadius, maxRadius = vg.Points(1), vg.Points(20)
    rng := maxRadius - minRadius
    _, _, z := bubbleData.XYZ(i)
    d := (z - minZ) / (maxZ - minZ)
    r := vg.Length(d)*rng + minRadius
    return draw.GlyphStyle{Color: c, Radius: r, Shape: draw.CircleGlyph{}}
  }
  p.Add(bs)

  if err = p.Save(4*vg.Inch, 4*vg.Inch, "bubble.png"); err != nil {
    log.Fatal(err)
  }
}

func randomTriples(n int) plotter.XYZs {
  data := make(plotter.XYZs, n)
  for i := range data {
    if i == 0 {
      data[i].X = rand.Float64()
    } else {
      data[i].X = data[i-1].X + 2*rand.Float64()
    }
    data[i].Y = data[i].X + 10*rand.Float64()
    data[i].Z = data[i].X
  }

  return data
}
|
我们生成一组三维坐标点,调用plotter.NewScatter()生成散点图。我们设置了GlyphStyleFunc钩子函数,在绘制每个点之前都会调用它,它返回一个draw.GlyphStyle类型,plot会根据返回的这个对象来绘制。我们的例子中,每次我们都返回一个表示圆形的draw.GlyphStyle对象,通过Z坐标与最大、最小坐标的比例映射到[vg.Points(1),vg.Points(20)]区间中得到半径。
生成的图像:
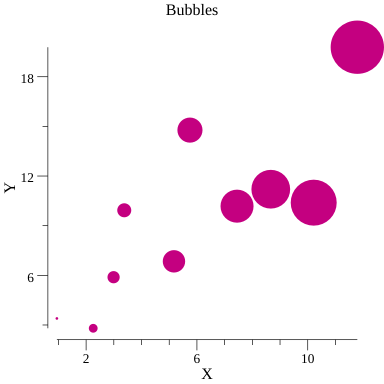
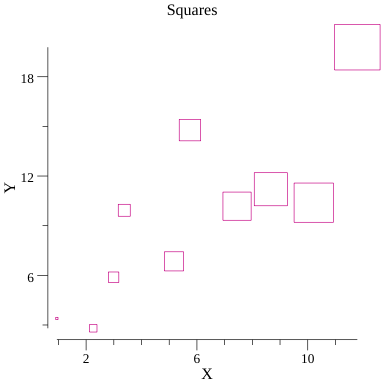
同样地,我们可以返回正方形的draw.GlyphStyle的对象来绘制“方形图”,只需要把钩子函数GlyphStyleFunc的返回语句做些修改:
1
|
return draw.GlyphStyle{Color: c, Radius: r, Shape: draw.SquareGlyph{}}
|
即可绘制“方形图”😄:
实际应用
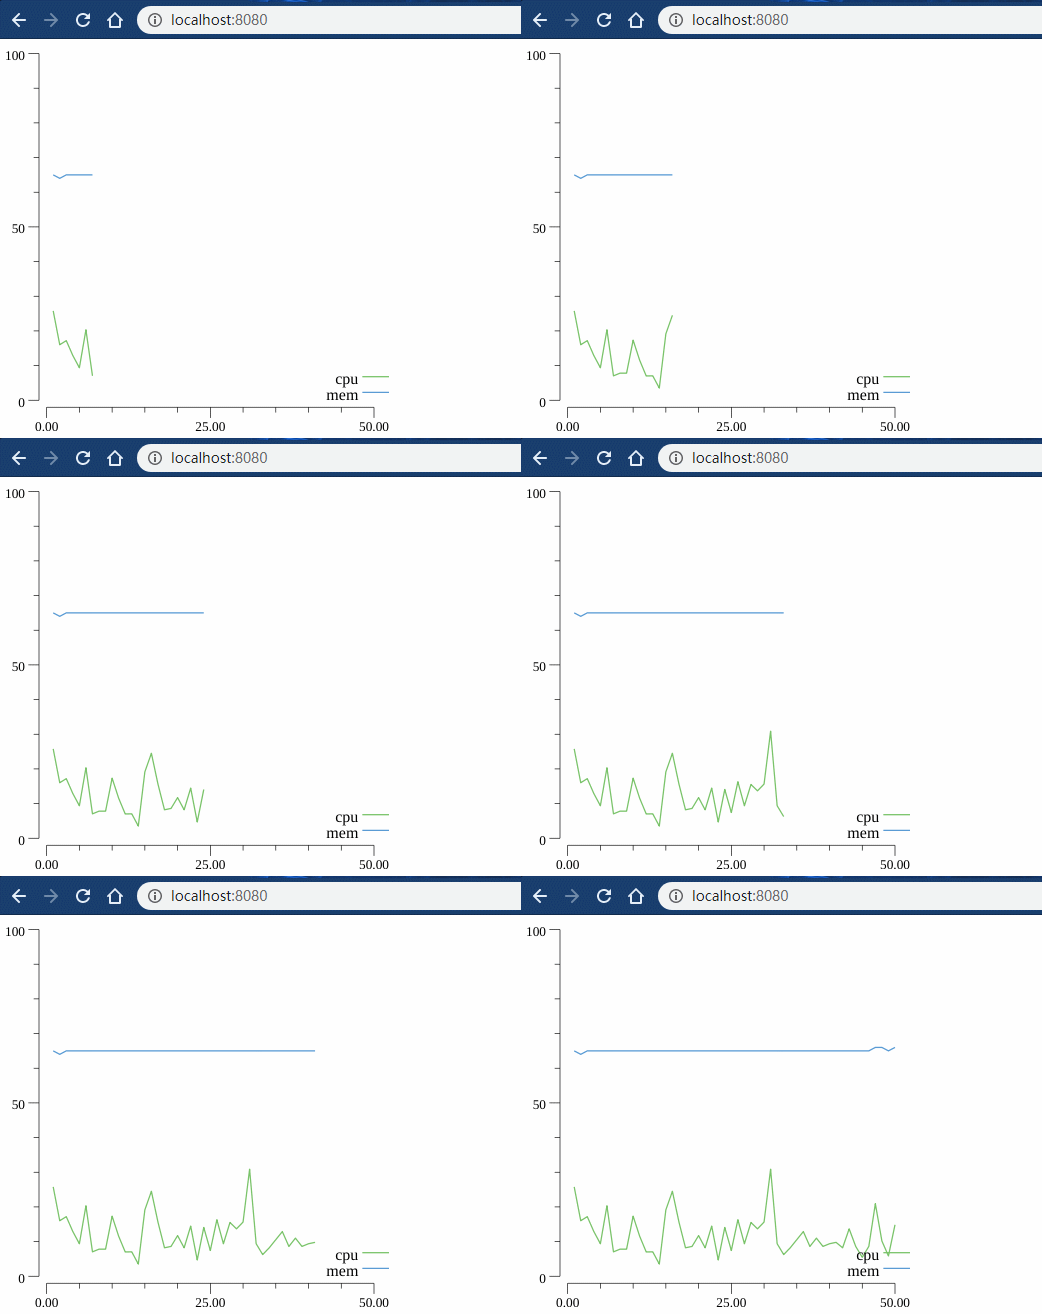
下面我们应用之前文章中介绍的gopsutil和本文中的plot搭建一个网页,可以实时观察机器的 CPU 和内存占用:
 1
 2
 3
 4
 5
 6
 7
 8
 9
10
11
12
13
14
15
16
17
18
19
20
21
22
23
24
25
26
27
28
|
func index(w http.ResponseWriter, r *http.Request) {
  t, err := template.ParseFiles("index.html")
  if err != nil {
    log.Fatal(err)
  }

  t.Execute(w, nil)
}

func image(w http.ResponseWriter, r *http.Request) {
  monitor.WriteTo(w)
}

func main() {
  mux := http.NewServeMux()
  mux.HandleFunc("/", index)
  mux.HandleFunc("/image", image)

  go monitor.Run()

  s := &http.Server{
    Addr:    ":8080",
    Handler: mux,
  }
  if err := s.ListenAndServe(); err != nil {
    log.Fatal(err)
  }
}
|
首先,我们编写了一个 HTTP 服务器,监听在 8080 端口。设置两个路由,/显示主页,/image调用Monitor的方法生成 CPU 和内存占用图返回。Monitor结构稍后会介绍。index.html的内容如下:
 1
 2
 3
 4
 5
 6
 7
 8
 9
10
11
12
13
14
15
16
17
|
<!DOCTYPE html>
<html lang="en">
<head>
  <meta charset="UTF-8">
  <meta name="viewport" content="width=device-width, initial-scale=1.0">
  <title>Monitor</title>
</head>
<body>
  <img src="/image" alt="" id="img">
  <script>
    let img = document.querySelector("#img")
    setInterval(function () {
      img.src = "/image?s=" + Math.random()
    }, 500)
  </script>
</body>
</html>
|
页面比较简单,就显示了一张图片。然后在 JS 中启动一个 500ms 的定时器,每隔 500ms 就重新请求一次图片替换现有的图片。我在设置img.src属性时在后面添加了一个随机数,这是为了防止缓存导致得到的可能不是最新的图片。
下面看看Monitor的结构:
 1
 2
 3
 4
 5
 6
 7
 8
 9
10
11
12
13
14
|
type Monitor struct {
  Mem       []float64
  CPU       []float64
  MaxRecord int
  Lock      sync.Mutex
}

func NewMonitor(max int) *Monitor {
  return &Monitor{
    MaxRecord: max,
  }
}

var monitor = NewMonitor(50)
|
这个结构中记录了最近的 50 条记录。每隔 500ms 会收集一次 CPU 和内存的占用情况,记录到CPU和Mem字段中:
 1
 2
 3
 4
 5
 6
 7
 8
 9
10
11
12
13
14
15
16
17
18
19
20
21
22
23
24
|
func (m *Monitor) Collect() {
  mem, err := mem.VirtualMemory()
  if err != nil {
    log.Fatal(err)
  }

  cpu, err := cpu.Percent(500*time.Millisecond, false)
  if err != nil {
    log.Fatal(err)
  }

  m.Lock.Lock()
  defer m.Lock.Unlock()

  m.Mem = append(m.Mem, mem.UsedPercent)
  m.CPU = append(m.CPU, cpu[0])
}

func (m *Monitor) Run() {
  for {
    m.Collect()
    time.Sleep(500 * time.Millisecond)
  }
}
|
当 HTTP 请求/image路由时,根据目前已经收集到的CPU和Mem数据生成图片返回:
 1
 2
 3
 4
 5
 6
 7
 8
 9
10
11
12
13
14
15
16
17
18
19
20
21
22
23
24
25
26
27
28
29
30
31
32
33
34
35
36
37
38
39
40
41
42
43
44
45
46
47
48
49
|
func (m *Monitor) WriteTo(w io.Writer) {
  m.Lock.Lock()
  defer m.Lock.Unlock()

  cpuData := make(plotter.XYs, len(m.CPU))
  for i, p := range m.CPU {
    cpuData[i].X = float64(i + 1)
    cpuData[i].Y = p
  }

  memData := make(plotter.XYs, len(m.Mem))
  for i, p := range m.Mem {
    memData[i].X = float64(i + 1)
    memData[i].Y = p
  }

  p, err := plot.New()
  if err != nil {
    log.Fatal(err)
  }

  cpuLine, err := plotter.NewLine(cpuData)
  if err != nil {
    log.Fatal(err)
  }
  cpuLine.Color = plotutil.Color(1)

  memLine, err := plotter.NewLine(memData)
  if err != nil {
    log.Fatal(err)
  }
  memLine.Color = plotutil.Color(2)

  p.Add(cpuLine, memLine)

  p.Legend.Add("cpu", cpuLine)
  p.Legend.Add("mem", memLine)

  p.X.Min = 0
  p.X.Max = float64(m.MaxRecord)
  p.Y.Min = 0
  p.Y.Max = 100

  wc, err := p.WriterTo(4*vg.Inch, 4*vg.Inch, "png")
  if err != nil {
    log.Fatal(err)
  }
  wc.WriteTo(w)
}
|
运行服务器:
打开浏览器,输入localhost:8080,观察图片变化:
总结
本文介绍了强大的绘图库plot,最后通过一个监控程序结尾。限于篇幅,plot提供的多种绘图类型未能一一介绍。plot还支持svg/pdf等多种格式的保存。感兴趣的童鞋可自行研究。
大家如果发现好玩、好用的 Go 语言库,欢迎到 Go 每日一库 GitHub 上提交 issue😄
参考
- plot GitHub:https://github.com/gonum/plot
- Example Plots: https://github.com/gonum/plot/wiki/Example-plots
- Go 每日一库 GitHub:https://github.com/darjun/go-daily-lib
我
我的博客:https://darjun.github.io
欢迎关注我的微信公众号【GoUpUp】,共同学习,一起进步~


